Matplotlib, Pyplot, Pylab etc: What's the difference between these and when to use each?
Last updated:
TL;DR: Matplotlib is the toolkit, PyPlot is an interactive way to use Matplotlib and PyLab is the same thing as PyPlot but with some extra shortcuts. Using PyLab is discouraged now.
All example notebooks can be found on this link
Matplolib
It's a Python plotting library, inspired by MATLAB, meaning that the terms used (Axis, Figure, Plots) will be similar to those used in MATLAB.
It can be used both within a Python system (via the object-oriented API) but also in more convenient form in Jupyter and IPython notebooks via the Pyplot interface.
Pyplot
PyPlot is a shell-like interface to Matplotlib, to make it easier to use for people who are used to MATLAB.
Pyplot maintains state across calls.
Useful for use in Jupyter or IPython notebooks.
Your can import it via the
matplotlib.pyplotnamespace.
import matplotlib.pyplot as plt
import numpy as np

x = np.linspace(0,10,9)
y = np.randn(9)

plt.scatter(x,y)
plt.show()
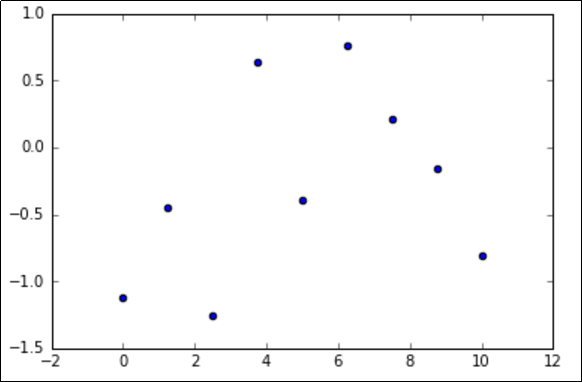 Simplest possible example:
 scatter function from pyplot namespace
Pylab
Someone had the idea of combining both the PyPlot and NumPy namespaces into a single one (to avoid having to import two namespaces), the result is PyLab.
Using Pylab is now discouraged.
from matplotlib.pylab import *

# you can now use both pyplot and numpy
# functions as if they had been imported

# from numpy namespace
x = linspace(0,10,9)

# from numpy.random namespace
y = randn(9)

# from pyplot namespace
scatter(x,y)
show()
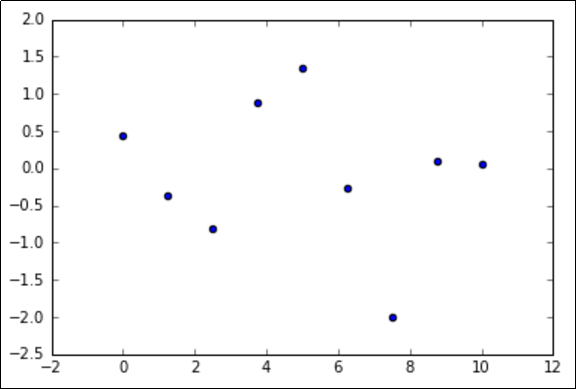 Functions like
 scatter() from pyplot are available when you import pylab too.
Key plotting concepts
These are important parts of the Matplotlib/Pyplot ecosystem and here are examples and information on what they stand for.
Matplotlib: Figure
Figure is the object that keeps the whole image output.
You can use it to configure things like:
Image size (
set_size_inches())Whether to use
tight_layout(set_tight_layout())- This adjusts the subplot padding; generally makes things look better.
Matplotlib: Axes
See all methods available in the Axes Class API
The Axes object represents the pair of axis that contain a single plot (x-axis and y-axis).
The Axes object has methods to allow you to configure things like:
The plot frame (
set_frame_on()orset_frame_off())X-axis and Y-axis limits (
set_xlim()andset_ylim())X-axis and Y-axis Labels (
set_xlabel()andset_ylabel())The plot title (
set_title())
Pyplot: plt.gcf()
GCF stands for Get Current Figure
plt.gcf() allows you to get a reference to the current figure when using pyplot.
Example: change image sizes using fig.set_size_inches()
import matplotlib.pyplot as plt
import numpy as np

x = np.linspace(0,10,9)
y = np.randn(9)

# this call creates a figure in the background
plt.scatter(x,y)

# this allows you to retrieve the figure created
# by the call to scatter() above
fig = plt.gcf()
fig.set_size_inches(6,2)

plt.show()
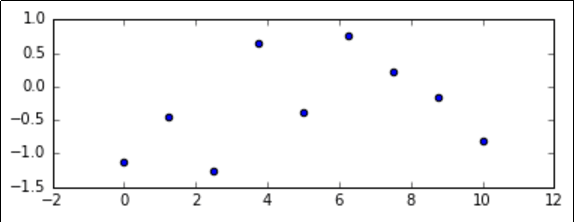 Same image as above, resized.
 We used the plt.gcf() function to get a reference to
the current figure and then called the
set_size_inches() method on it.
Pyplot: plt.gca()
GCA stands for Get Current Axes
Same as with plt.gcf(), you can use plt.gca() to get a reference to the current axes, if you need to change the limits on the y-axis, for example.
import matplotlib.pyplot as plt
import numpy as np

x = np.linspace(0,10,9)
y = np.randn(9)

# this call creates a figure in the background
plt.scatter(x,y)

# this allows you to retrieve the axis
# in the figure created
# by the call to scatter() above
axis = plt.gca()
axis.set_ylim(-3,3)

plt.show()
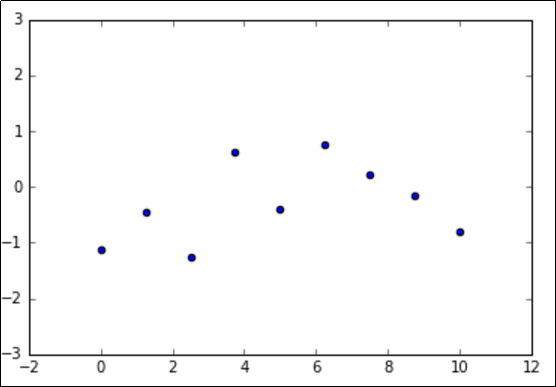 Note that the y-axis now ranges from -3 to 3.
 We got a reference to the current axis by
calling plt.gca(). Then we called the set_lim()
method to adjust the limits for that axis.
Pyplot: plt.cla() VS plt.clf()
cla stands for 'clear current axes' and clf stands for 'clear current figure'
These methods are used to clear the current figure (plt.clf()) or the current axes (plt.cla()).
It's common to call these methods just before defining a chart so that previous plots don't interfere with the next ones.