SAS Examples: Proc Freq
Last updated:- Sample data
- Simplest possible proc freq
- Save output to another table
- Show missing data separately
- Proc freq with histogram
- Histogram with continuous data
- Two-way histogram
- Two-way histogram with continuous data
Download the source file here
Sample data
data mytable;

    input id= name=$12. balance= state=$2.;

DATALINES;
id=1 name=alice balance=5.12 state=NE
id=2 name=bob  balance=12.31 state=SC
id=3 name=charlie balance=45.14 state=NY
id=4 name=daniel balance=32.78 state=
id=5 name=alice balance=20.23 state=WA
id=6 name=bob balance=70.89 state=NM
id=7 name=gabe balance=29.67 state=NM
id=8 name=charlie balance=55.66 state=CA
id=9 name=ivan balance= state=
;
run;
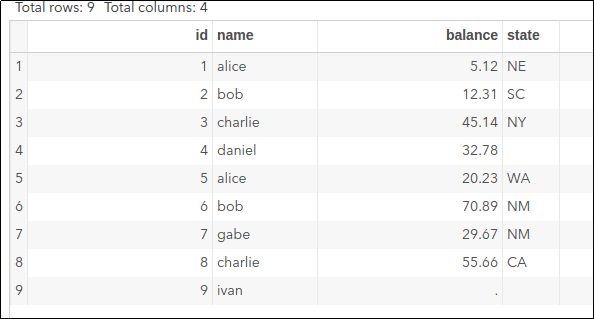 Original data
Simplest possible proc freq
Outputs the frequency for each value in column <column> on table <library>.<source_table>.
proc freq data=mytable;
    tables state;
run;
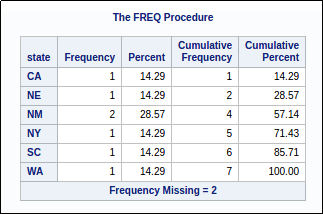 Simple proc freq output for the
 state column
Save output to another table
Do proc freq while also saving the results to othertable
proc freq data=mytable;
    tables <column> / out=othertable;
run;
Show missing data separately
Output a frequency table and a histogram for column <column> on table <library>.<source_table>, including missing data as a separate category.
proc freq data=mytable;
    tables state / missing;
run;
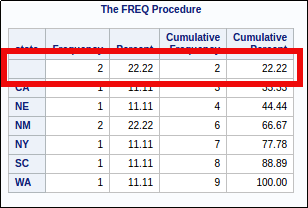 The marked row shows stats for missing values
Proc freq with histogram
Output a frequency table and a histogram for column state.
ods graphics on;
proc freq data=mytable;
    tables state / plots=freqplot();
run;
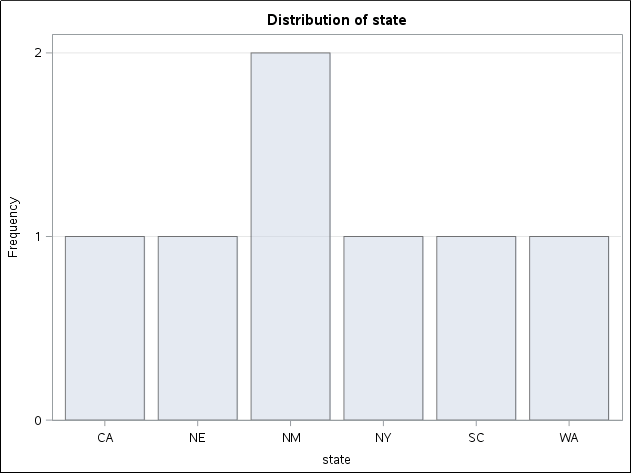 Note that missing data are not included.
Histogram with continuous data
It's very common to create a FORMAT to bin your data into separate groups, so that you can view continuous data as buckets.
proc format;
    value balance_bins
        0       = "Exactly 0"
        0 -< 10 = "Up to US$ 10"
        10 -< 20 = "From US$ 10 to US$ 20"
        20 -< 30 = "From US$ 20 to US$ 30"
        30 -< 40 = "From US$ 30 to US$ 40"
        40 -< 50 = "From US$ 40 to US$ 50"
        50 - high = "Above US$ 50"
        . = "No data"
        other = "???";
run;

ods graphics on;
proc freq data=mytable;
    tables balance/ missing plots=freqplot;
    format balance balance_bins.;
run;
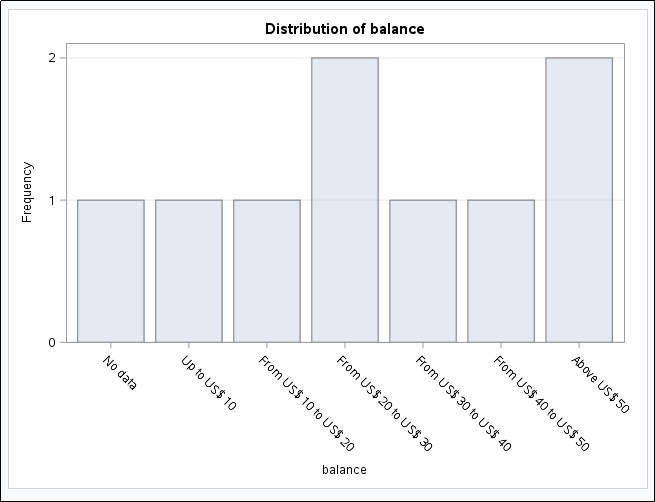 Use can use formats to group continuous variables into buckets
Two-way histogram
You want to see the distribution of one categorical variable versus the other.
This will group the results by the FIRST element, namely
state. You can also usegroupby=columnto group the results byname
ods graphics on;
proc freq data=mytable;
tables state*name / plots=freqplot(groupby=row twoway=stacked);
run;
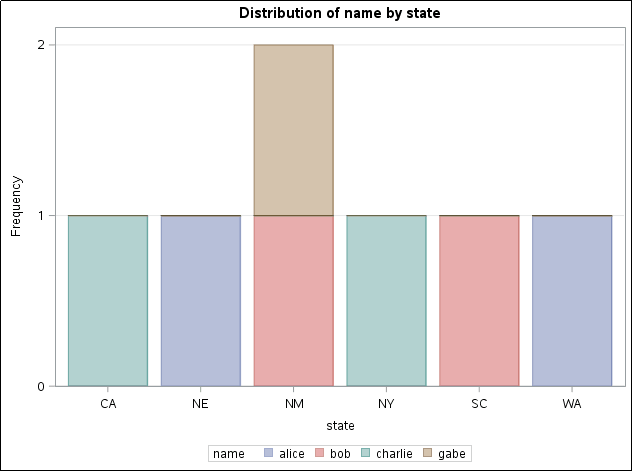 Two-way proc freq histogram
Two-way histogram with continuous data
Again, use proc format to turn continuous into discrete data:
proc format;
  value balance_bins
    0       = "Exactly 0"
    0 -< 10 = "Up to US$ 10"
    10 -< 20 = "From US$ 10 to US$ 20"
    20 -< 30 = "From US$ 20 to US$ 30"
    30 -< 40 = "From US$ 30 to US$ 40"
    40 -< 50 = "From US$ 40 to US$ 50"
    50 - high = "Above US$ 50"
    . = "No data"
    other = "???";
run;

ods graphics on;
proc freq data=mytable;
tables state*balance / plots=freqplot(groupby=row twoway=stacked);
format balance balance_bins.;
run;
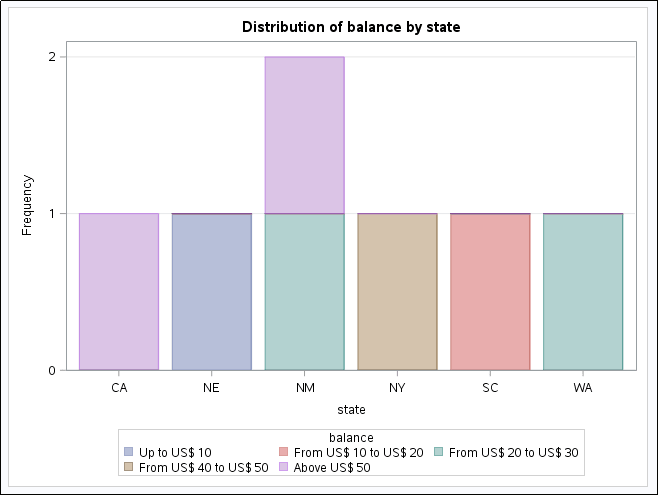 You can also use formats for two-way plots