Seaborn by Example: Data Visualization and Plotting using Python
Last updated:Table of Contents
WIP Alert This is a work in progress. Current information is correct but more content may be added in the future.
Seaborn vs Matplotlib
Seaborn is not a replacement for Matplotlib.
Seaborn is a higher-level interface to Matplotlib.
- It uses Matplotlib behind the scenes.
Seaborn has much tighter integration with Pandas.
- For example, it uses the column's
dtypeto infer the best way to display the data.
- For example, it uses the column's
| Matplotlib | Seaborn |
|---|---|
| Low-level | High-level |
| Reasonably integrated with Pandas | Tightly integrated with Pandas |
| Focus on flexibility and functionality | Focus on convenience and visualization |
Full notebook available on this link
Plot 1D data using distplot
distplot stands for Distribution Plot.
import numpy as np
import seaborn as sns

# draws 100 samples from a standard normal distribution
# (mean=0 and std-deviation=1)
x = np.random.normal(size=100)

sns.distplot(x)
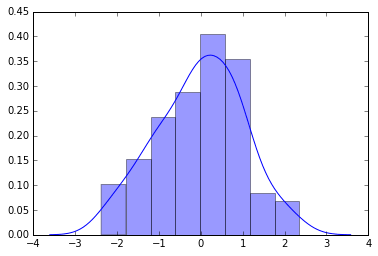 Plotting a 1-d numpy ndarray using default arguments using Seaborn's
 distplot