Evaluation Metrics for Classification Problems: Quick Examples + References
Last updated:
True Positives (TP): should be TRUE, you predicted TRUE
False Positives (FP): should be FALSE, you predicted TRUE
True Negative (TN): should be FALSE, you predicted FALSE
False Negatives (FN): should be TRUE, you predicted FALSE
All machine learning toolkits provide these model evaluation metrics.
Accuracy
"What percentage of my predictions are correct?"
$$ \text{Accuracy} = \frac{true \ positives + true \ negatives}{true \ positives + false \ positives + true \ negatives + false \ negatives} $$
Good for single label, binary classifcation.
Not good for imbalanced datasets.
- If, in the dataset, 99% of samples are TRUE and you blindly predict TRUE for everything, you'll have 0.99 accuracy, but you haven't actually learned anything.
Precision
"Of the points that I predicted TRUE, how many are actually TRUE?"
$$ \text{Precision} = \frac{true \ positives}{true \ positives + false \ positives} $$
Good for multi-label / multi-class classification and information retrieval
Good for unbalanced datasets
Recall
"Of all the points that are actually TRUE, how many did I correctly predict?"
$$ \text{Recall} = \frac{true \ positives}{true \ positives + false \ negatives} $$
Good for multi-label / multi-class classification and information retrieval
Good for unbalanced datasets
F1
"Can you give me a single metric that balances precision and recall?"
$$ F_1 = 2 \cdot \frac{Precision \cdot Recall}{Precision + Recall} $$
Or, in terms of primitive metrics:
$$ F_1 = \frac{2 \cdot true \ positives}{2 \cdot true \ positives + false \ negatives + false \ positives} $$
Gives equal weight to precision and recall
Good for unbalanced datasets
AUC (Area under ROC Curve)
"Is my model better than just random guessing?"
- The ROC curve is obtained plotting your model's true-positive and false-positive rates at different points.
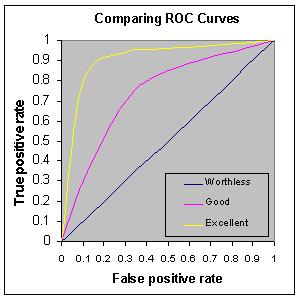 If your model scores less than 0.5 AUC, it's no better than just random guessing.
 Source: http://gim.unmc.edu/dxtests/roc3.htm
Rank-based metric
Good for cases when you need to estimate how well your model is at discriminating TRUE from FALSE values.
- In other words, for every pair of instances A and B, when your model says A is more likely than B, how often is A is actually TRUE and B FALSE?
Gini Coefficient
The Gini coefficient is comparable to the AUC score inasmuch as it also is a rank-based metric that can be used to measure how well your model is at discriminating TRUE from FALSE values.
Rank-based metric
It ranges from 0 (chance results) to 1.0, which corresponds to perfect discrimination.
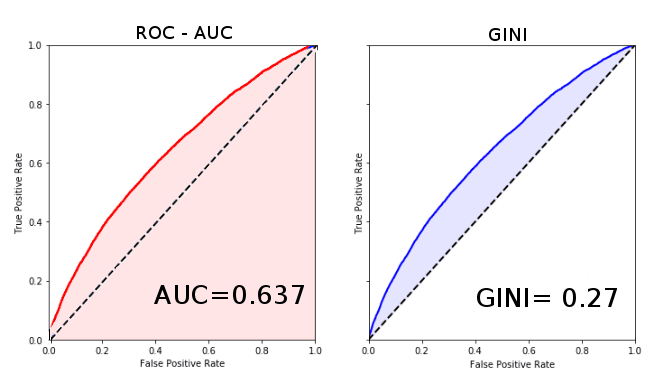 A comparison between AUC Score and Gini Index on the same scoring results.
 Note that the Gini index corresponds to the area between the main diagonal and the model curve, while
the AUC corresponds to the full area under the ROC curve.
Adapted from https://bit.ly/2Jb6LtQ
This short post is part of the data newsletter. Click here to sign up.