Matplotlib Examples: Displaying and Configuring Legends
Last updated:- Add legend to plot
- Add legend to multiple plots in the same axis
- Add legend to axis
- Change legend location
- Disable legend
- Change number of columns in legend
- Legend outside axes
- Reorder labels in legend
Confused about pyplot and matplotlib? See Matplotlib, Pyplot, Pylab etc: What's the difference between these and when to use each?
All examples assume you're working on the pyplot interface.
All code is available online on this jupyter notebook
Add legend to plot
Call plt.legend([list-of-titles]).
Note that the argument is a list of legends. Pass a list with a single element to have a single legend:
import numpy as np
import matplotlib.pyplot as plt

# generate random data for plotting
x = np.linspace(0.0,100,50)
y = np.random.normal(size=50)

plt.plot(x,y)

# call method plt.legend
plt.legend(['line plot 1'])

plt.show()
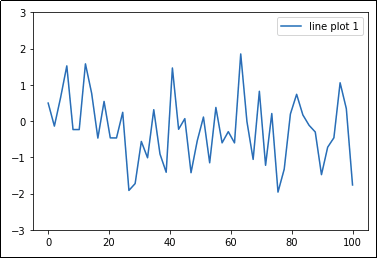 Call plt.legend() with a list of legends as arguments.
 This is the simplest possible use case.
Add legend to multiple plots in the same axis
While you can just pass a list with multiple texts to plt.legend(), it's better to label each plot individually so there are no errors.
1) Add a
labelparameter to each plot.2) Call
plt.legend()with no parameters
import numpy as np
import matplotlib.pyplot as plt

# generate random data for plotting
x = np.linspace(0.0,100,20)

# now there's 3 sets of points
y1 = np.random.normal(scale=0.2,size=20)
y2 = np.random.normal(scale=0.5,size=20)
y3 = np.random.normal(scale=0.8,size=20)

# plot the 3 sets
plt.plot(x,y1,label='plot 1')
plt.plot(x,y2, label='plot 2')
plt.plot(x,y3, label='plot 3')

# call with no parameters
plt.legend()

plt.show()
 Each line plot gets its own legend
Add legend to axis
For more info on how to plot multiple plots in the same Figure, see Matplotlib Subplots: Best Practices and Examples
If there are multiple axes on your plot, you can add legends to a single axis if you wish. Just call ax.legend()
import numpy as np
import matplotlib.pyplot as plt

# create multiple plots via plt.subplots(rows,columns)
fig, axes = plt.subplots(2,2)

# just plot things on each individual axes
x = np.linspace(0.0,100,20)
y1 = np.random.normal(scale=0.2,size=20)
y2 = np.random.normal(scale=0.5,size=20)
y3 = np.random.normal(scale=0.8,size=20)

# one plot on each subplot
axes[0][0].scatter(x,y1)
axes[0][1].bar(x,y1)
axes[1][0].scatter(x,y2)
axes[1][1].plot(x,y2)

# you can set a legend for a single subplot
axes[1][1].legend(['plot 4'])

plt.show()
 Only the last axes has had a legend set, by calling
 legend() on the axis
Change legend location
If you don't provide a location for the legend, matplotlib tries to figure out by itself where it should place it.
To force another location, set parameter loc using location a string (e.g. 'upper left' or 'lower right') as argument.
import numpy as np
import matplotlib.pyplot as plt

x = np.linspace(0.0,100,50)
y = np.random.uniform(low=0,high=10,size=50)

plt.plot(x,y)

plt.legend(['Example legend'],loc='upper center')

plt.show()
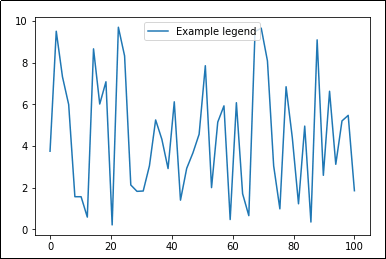 Other values for
 loc include 'upper right', 'upper left', 'lower center', 'lower right' and 'best' (
'best' is the default value, matplotlib tries to figure out where to place it).
Disable legend
this must be AFTER the call to plot
Some libraries such as Pandas default to setting legends in plots.
So if legends are being set for some reason and you want to get rid of them, call ax.legend_.remove()
import numpy as np
import matplotlib.pyplot as plt
import pandas as pd

# generate random data for plotting
x = np.linspace(0.0,100,50)
y = x*2

df = pd.DataFrame({
    'x':x,
    'y':y
})

# this will add legends by default
df.plot(kind='line')

plt.gca().legend_.remove()

plt.show()
 No legends
Change number of columns in legend
If you have many lines or plots in the same axes, it can get a litle bit difficult to view them all.
Change parameter ncol if you need to:
 By default, the legend has a single column
 Legend looks a bit neater with two
 columns instead of one.
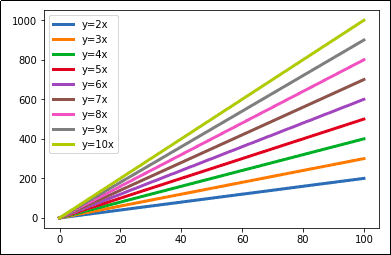
Legend outside axes
Use argument bbox_to_anchor to reposition the legend box.
For example, to set the legend box to the right of the plot area:
import numpy as np
import matplotlib.pyplot as plt

# generate random data for plotting
x = np.linspace(0.0,100,50)
y2 = x*2
y3 = x*3
y4 = x*4
y5 = x*5

# plot 5 lines in the axes
plt.plot(x,y2,label='y=2x')
plt.plot(x,y3,label='y=3x')
plt.plot(x,y4,label='y=4x')
plt.plot(x,y5,label='y=5x')

# use parameter bbox_to_anchor to reposition
# the legend box outside the plot area
plt.gca().legend(loc='center left', bbox_to_anchor=(1, 0.5))

plt.show()
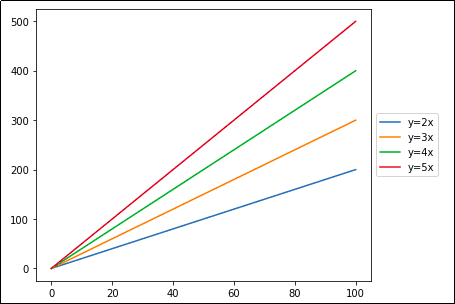 Positioning the legend outside the plot area is
 useful when you have many lines
in the same plot.
Reorder labels in legend
If you can afford to plot using pandas, you can just use
df.plot(legend='reverse')to achieve the same result
Sometimes the order in which legend labels are displayed is not the most adequate.
For example, in the first graph, the order the labels are shown does not match the order the lines are plotted, so it can make visualization a bit harder, especially when there are many groups of data in the same axes.
To modify legend labels:
1) get current labels via
get_legend_handles_labels()after plotting.2) sort the handles (images) and labels the way you want.
3) call
plt.legend()passing the modified handles and labels.
import numpy as np
import matplotlib.pyplot as plt

# generate random data for plotting
x = np.linspace(0.0,100,50)

y2 = x*2
y3 = x*3
y4 = x*4
y5 = x*5
y6 = x*6
y7 = x*7

# plot multiple lines
plt.plot(x,y2,label='y=2x')
plt.plot(x,y3,label='y=3x')
plt.plot(x,y4,label='y=4x')
plt.plot(x,y5,label='y=5x')
plt.plot(x,y6,label='y=6x')
plt.plot(x,y7,label='y=7x')

# get current handles and labels
# this must be done AFTER plotting
current_handles, current_labels = plt.gca().get_legend_handles_labels()

# sort or reorder the labels and handles
reversed_handles = list(reversed(current_handles))
reversed_labels = list(reversed(current_labels))

# call plt.legend() with the new values
plt.legend(reversed_handles,reversed_labels)

plt.show()
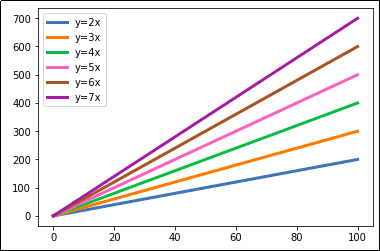 Plot with default legend options
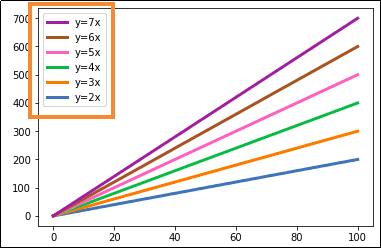 After reordering the labels in the legend,
 they now match the order in which the
lines were drawn, making it easier
to know which line is which.