Add Labels and Text to Matplotlib Plots: Annotation Examples
Last updated:- Add text to plot
- Add labels to line plots
- Add labels to bar plots
- Add labels to points in scatter plots
- Add text to axes
Used matplotlib version 3.x. View all code on this notebook
Add text to plot
See all options you can pass to plt.text here: valid keyword args for plt.txt
Use plt.text(<x>, <y>, <text>):
import matplotlib.pyplot as plt
import numpy as np

plt.clf()

# using some dummy data for this example
xs = np.arange(0,10,1)
ys = np.random.normal(loc=2.0, scale=0.8, size=10)

plt.plot(xs,ys)

# text is left-aligned
plt.text(2,4,'This text starts at point (2,4)')

# text is right-aligned
plt.text(8,3,'This text ends at point (8,3)',horizontalalignment='right')

plt.show()
 Text can be left- or right-aligned
Add labels to line plots
Again, zip together the data (x and y) and loop over it, call plt.annotate(<label>, (<x>,<y>))
import matplotlib.pyplot as plt
import numpy as np

plt.clf()

# using some dummy data for this example
xs = np.arange(0,10,1)
ys = np.random.normal(loc=3, scale=0.4, size=10)

# 'bo-' means blue color, round points, solid lines
plt.plot(xs,ys,'bo-')

# zip joins x and y coordinates in pairs
for x,y in zip(xs,ys):

    label = "{:.2f}".format(y)

    plt.annotate(label, # this is the text
                 (x,y), # these are the coordinates to position the label
                 textcoords="offset points", # how to position the text
                 xytext=(0,10), # distance from text to points (x,y)
                 ha='center') # horizontal alignment can be left, right or center

plt.show()
 Labels contain the value of Y, with 2 decimal places
Add labels to bar plots
Loop over the arrays (xs and ys) and call plt.annotate(<label>, <coords>):
import matplotlib.pyplot as plt
import numpy as np

plt.clf()

# using some dummy data for this example
xs = np.arange(0,10,1)
ys = np.random.normal(loc=3, scale=0.4, size=10)

plt.bar(xs,ys)

# zip joins x and y coordinates in pairs
for x,y in zip(xs,ys):

    label = "{:.2f}".format(y)

    plt.annotate(label, # this is the text
                 (x,y), # these are the coordinates to position the label
                 textcoords="offset points", # how to position the text
                 xytext=(0,10), # distance from text to points (x,y)
                 ha='center') # horizontal alignment can be left, right or center

plt.show()
 As created with the above code
Add labels to points in scatter plots
Loop over the data arrays (x and y) and call plt.annotate(<label>, <coords>) using the value itself as label:
import matplotlib.pyplot as plt
import numpy as np

# using some dummy data for this example
xs = np.random.randint( 0, 10, size=10)
ys = np.random.randint(-5, 5,  size=10)

# plot the points
plt.scatter(xs,ys)

# zip joins x and y coordinates in pairs
for x,y in zip(xs,ys):

    label = f"({x},{y})"

    plt.annotate(label, # this is the text
                 (x,y), # these are the coordinates to position the label
                 textcoords="offset points", # how to position the text
                 xytext=(0,10), # distance from text to points (x,y)
                 ha='center') # horizontal alignment can be left, right or center
 As created by the above code
Add text to axes
This is useful if you have subplots (more examples here)
To add text to an individual Axes object just call ax.annotate(<text>, <xy_coords>):
import matplotlib.pyplot as plt
import numpy as np

# generate sample data to plot
x = np.linspace(0.0,100,50)
y = np.random.uniform(low=0,high=10,size=50)

# get references to the 2 axes with plt.subplots()
fig, (ax1, ax2) = plt.subplots(1,2)

ax1.bar(x,y)

# add text to the axes on the left only
ax1.annotate('Some text in axes ax1',
             (40, 8), # these are the coordinates to position the label
             color='red') # you can pass any extra params too

ax2.bar(x,y)
# add text to the other axes (on the right)
ax2.annotate('More text in axes ax2',
             (40, 8), # these are the coordinates to position the label
             color='black',
             size=16)
 Text added individually to each
 Axes instance, (generated with
plt.subplots())
String tick labels
You want to position text in the plot but your plot also uses string tick labels, so you can't just use annotate('some-text', ('a', 4)) because you need actual integer x,y coordinates.
import matplotlib.pyplot as plt
import numpy as np

# generate sample data for this example
xs = [1,2,3,4,5,6,7,8,9,10,11,12]
ys = np.random.normal(loc=3.0,size=12)
labels = ['jan','feb','mar','apr','may','jun','jul','aug','sept','oct','nov','dec']

# plot
plt.bar(xs,ys)

# apply custom tick labels
plt.xticks(xs,labels)

# this is the x-axis label you want to write the text for
string_label = "feb"

# figure out which x-axis tick corresponds to that
label_index = labels.index(string_label)
xs_index    = xs[label_index]

# use xs_index to position the text
plt.annotate("foo-bar",
             (xs_index,4)) # these are the coordinates to position the label
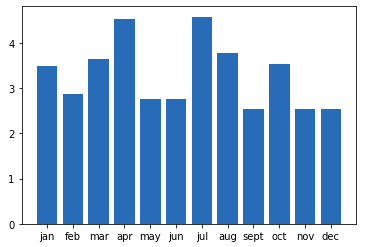 BEFORE: source image without text
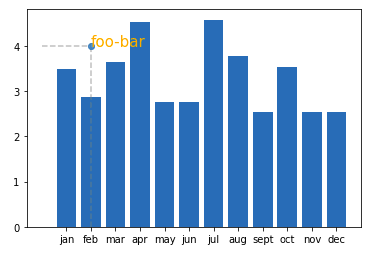 AFTER: you added some text positioned
 exactly at what would be
('feb',4) coordinates