JVM Performance Monitoring 101: Commonly Used Open Source Tools + Examples
Last updated:
WIP Alert This is a work in progress. Current information is correct but more content will probably be added in the future.
JVM installations make a lot of information available for you if you want to track the state of your applications; among the most useful are:
- Memory Usage (Heap, Non-Heap, etc)
- Threads (active threads, idle threads, etc)
- CPU Usage
- I/O (Disk access, network, etc)
- Garbage collection (GC)
Here are the most widely used tools that help you track the behaviour and performance of your JVM-based application.
JConsole has been listed first since it's available out-of-the-box in all JVM installations; other tools are listed alphabetically.
JConsole
| Pros | Cons |
|---|---|
| Included in the JVM | Resource-hungry |
| Only low-level metrics |
JConsole is a basic, but broad and complete graphic tool for monitoring and snapshotting JVM applications.
It is available in most JVM installations. Start it by entering jconsole into your terminal.
Among the things you can track with jconsole are heap memory, classes, CPU, threads.
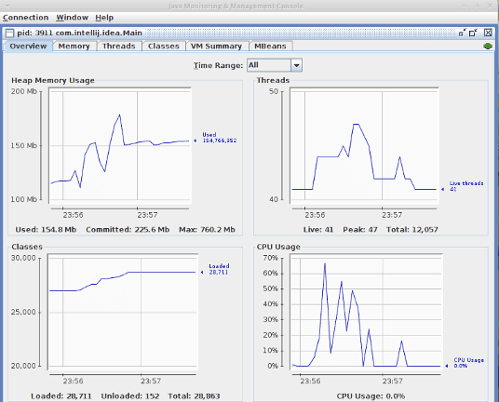 Monitoring Intellij Idea IDE with jconsole: overview tab
In addition, you can view and interact with all knobs exposed by the JVM instrumentation framework (JMX).
These are called MBeans and some of them are read-only (e.g. get JVM uptime or some value for a Java Option) while some of them are actions you can execute, such as forcing the Garbage Collector (GC) to run:
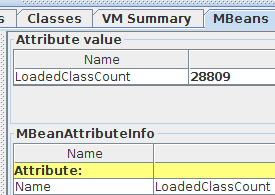 Viewing LoadedClassCount MBean
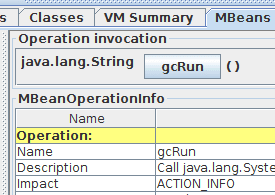 gcRun() is an actionable MBean
javamelody
| Pros | Cons |
|---|---|
| Low and high-level metrics | |
| Extra information for Web apps | Geared towards traditional Java EE apps |
| Not much overhead |
Javamelody is more geared towards traditional Java EE web apps, such as those deployed on Tomcat, JBoss, etc. There are special setups for common frameworks such as EJB and Spring.
It monitors and displays more than just raw JVM metrics such as memory or CPU usage; in addition to those, you can use it to track higher-level information, such as active JDBC connections, active Http sessions, % of errors in Http requests, network transfers and so on:
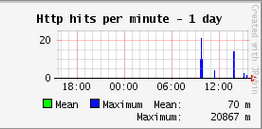 Showing HTTP hits in a day for a Java Web app
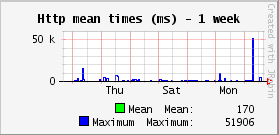 Another tile showing the mean response time for HTTP requests
JPS
| Pros | Cons |
|---|
jstat
| Pros | Cons |
|---|
Metrics
| Pros | Cons |
|---|
Moskito
| Pros | Cons |
|---|
SJK
| Pros | Cons |
|---|
VisualVM
| Pros | Cons |
|---|
JMX
JMX is a set of standards and APIs used by most if not all monitoring tools above.
Normally you will not need to do anything about it, except if you want to monitor your JVM application from a remote computer (as opposed to running the monitoring tool in the same computer your application is running).
In this case you need to explicitly enable it by setting the following Java Option when starting the JVM application you wish to monitor:
com.sun.management.jmxremote.port=portNum
in addition to any others you already use. This will enable remote tools to access your JVM metrics by listening in the given port.