Matplotlib Examples: Drawing Straight Lines
Last updated:- Horizontal line
- Vertical line
- Vertical line, string axis
- 45 degree line passing through point
- Using Coordinates
- Dotted line
- Dashed line
All code available online on this jupyter notebook
Horizontal line
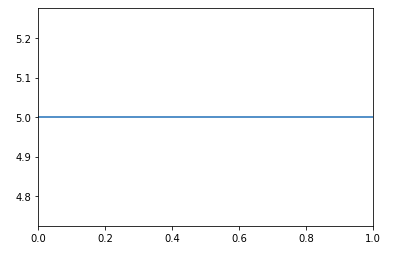
Use plt.axhline(height) to draw a horizontal line at a given height
import matplotlib.pyplot as plt

height = 5

plt.axhline(y=height)
 Using
Using axhline is the simplest way to draw a horizontal line in matplotlib
Vertical line
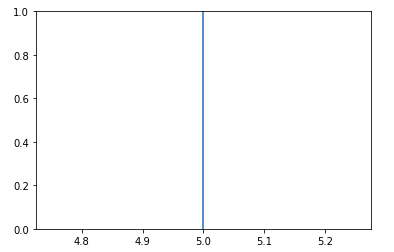
Use plt.axvline() to draw a vertical line at a given position:
import matplotlib.pyplot as plt

x_level = 5

plt.axvline(x=x_level)
 Use
Use axvline to draw a vertical line anywhere
Vertical line, string axis
If your x-axis has strings or categories instead of numbers you can also call plt.axvline()
import matplotlib.pyplot as plt

# sample data
days   = ['sun','mon','tue','wed','thu','fri','sat']
values = [1    , 4   , 4   , 8   , 3   , 4   , 3   ]

# plotting bars for comparison
plt.bar(days, values)

plt.axvline('thu', color='red')
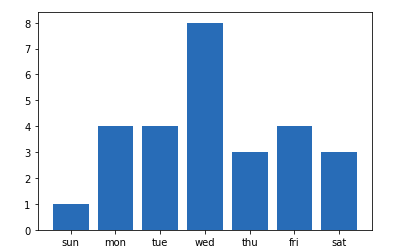 BEFORE: a plot with string
 labels in the x-axis
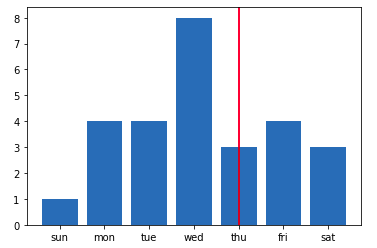 AFTER: call
 plt.axvline('thu') to draw a vertical line on 'Thu'
45 degree line passing through point
Use plt.axline(point, slope)
The slope is given in the units of the chart so you need to calcualte it based on your points:
import matplotlib.pyplot as plt
import numpy as np


# note that the x-axis is 10 times as large (in magnitude)
# as the y-axis
xs = np.random.uniform(0,100,100)
ys = np.random.uniform(0,10,100)

# just to populate the plot
plt.scatter(xs,ys,s=0.6)

# An angle of 45 degrees means a slope of 1 (relatively)
slope = (ys.max() - ys.min()) / (xs.max() - xs.min())

plt.axline((1,2),slope=slope)
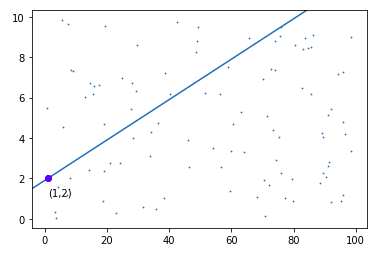 We first need to calculate the
 slope becase it depends on the magnitude of the axes.
Then we just call
plt.axline() passing the point and the slope.
Using Coordinates
Use plt.axline((x1,y1),(x1,y2)) to draw an infinitely long line passing through (x1,y1) and (x2,y2)
Example: Draw a line passing through (1,2) and (5,7)
import matplotlib.pyplot as plt

plt.axline((1,2),(5,7))
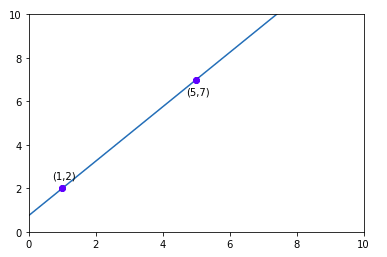 Use can also use
 plt.axline() to draw arbitrary lines from one point to another
Dotted line
You can pass any of the styles here to "linestyle"
Just pass linestyle='dotted' to either plt.axvline(), plt.axhline() or plt.axline():
import matplotlib.pyplot as plt

plt.axhline(y=5,linestyle='dotted')
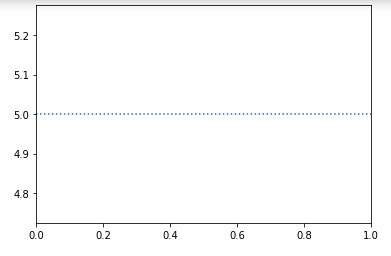 Horizontal dotted line
Dashed line
Again, everything here can be used in "linestyle"
Pass linestyle='dashed' to any of plt.axhline(), plt.axvline() or plt.axline():
import matplotlib.pyplot as plt

plt.axvline(x=5,linestyle='dashed')
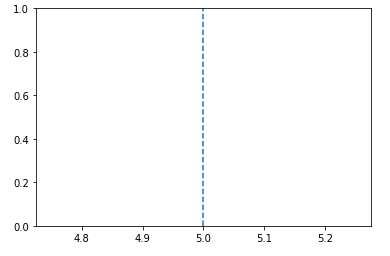 Dashed line, vertical