Matplotlib Examples: Plots with String Axis Labels
Last updated:Table of Contents
WIP Alert This is a work in progress. Current information is correct but more content may be added in the future.
Bar plot
Full code available here
Just call plt.xticks(x_values, labels).
Example: use months of the year as the x-axis labels
import matplotlib.pyplot as plt
import numpy as np

# generate sample data for this example
xs = [1,2,3,4,5,6,7,8,9,10,11,12]
ys = np.random.normal(loc=3.0,size=12)
labels = ['jan','feb','mar','apr','may','jun','jul','aug','sept','oct','nov','dec']

plt.bar(xs,ys)

# HERE tell pyplot which labels correspond to which x values
plt.xticks(xs,labels)
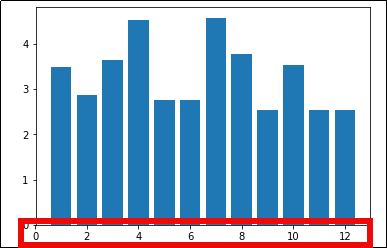 If you don't set labels,
 each label is the value itself
 Set string labels using
 plt.xticks(xs,labels)
Horizontal bar plot
Full code available here
Example: using the months of the year as the y-axis in a horizontal bar plot
import matplotlib.pyplot as plt
import numpy as np

# generate sample data for this example
xs = [1,2,3,4,5,6,7,8,9,10,11,12]
ys = np.random.normal(loc=3.0,size=12)
labels = ['jan','feb','mar','apr','may','jun','jul','aug','sept','oct','nov','dec']

plt.barh(xs,ys)

# HERE tell pyplot which labels correspond to which x values
plt.yticks(xs,labels)
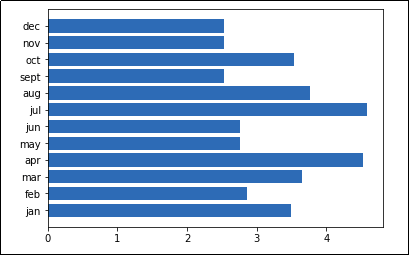 Horizontal bar plots are a useful alternative
 when there is not enough space for labels
on the x (horizontal) axis
Set labels for individual Axes
TODO