Splunk Examples: Calculating Ratios Between Events
Last updated:Table of Contents
All examples use the tutorial data from Splunk running on a local Splunk version
Calculate ratio between events
Short answer
Use this template, replacing the values within < and > with your own values
index="tutorialdata"
| eval numerator=<IF_CLAUSE_REPRESENTING_THE_NUMERATOR>
| eval denominator=<IF_CLAUSE_REPRESENTING_THE_DENOMINATOR>
| timechart sum(numerator) as "numerator", sum(denominator) as "denominator"
| eval ratio=(numerator/denominator)
| table _time, ratio
Long answer
Calculating ratios and percentages between different events is useful for showing:
- timeout rates
- failure rates
- ratios between two quantities
For this example, suppose you have this log for the number of sales by each VendorID, per unit time):
index="tutorialdata"
| timechart count by VendorID
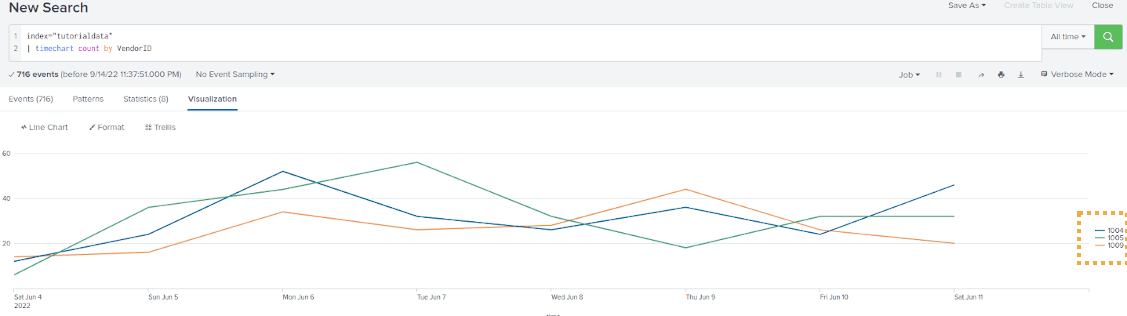 Three events taking place
Ỳou now want to plot the ratio between VendorID 1004 and the total, to see what fraction of the total sales was made by 1004:
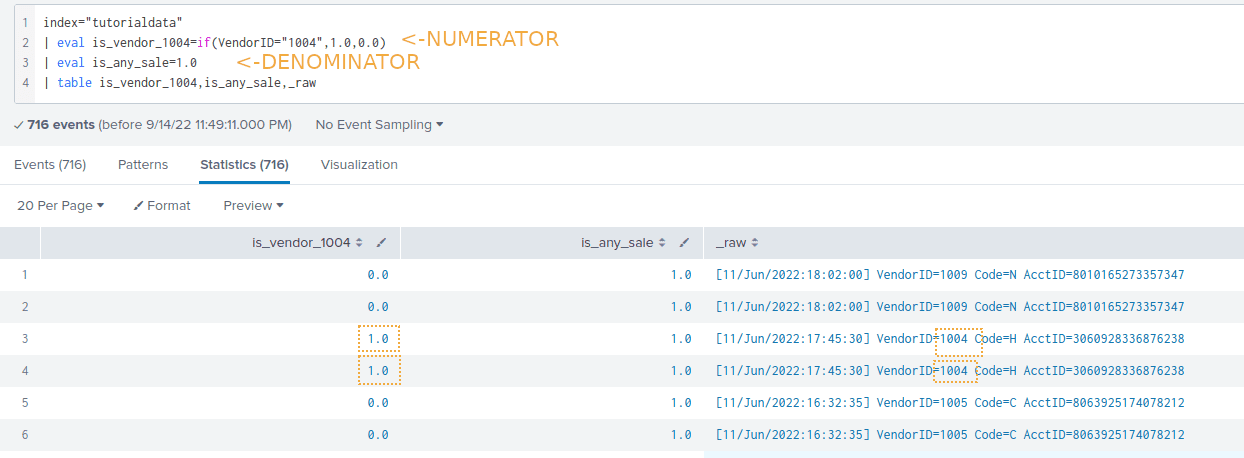 Create one variable for the numerator and another one for the denominator like this
Example: Plot the ratio of sales made by Vendor 1004 over time:
index="tutorialdata"
| eval is_vendor_1004=if(VendorID="1004",1.0,0.0)
| eval is_any_vendor=1.0
| timechart sum(is_vendor_1004) as "numerator", sum(is_any_vendor) as "denominator"
| eval ratio_of_sales_by_vendor_1004=(numerator/denominator)
| table _time, ratio_of_sales_by_vendor_1004
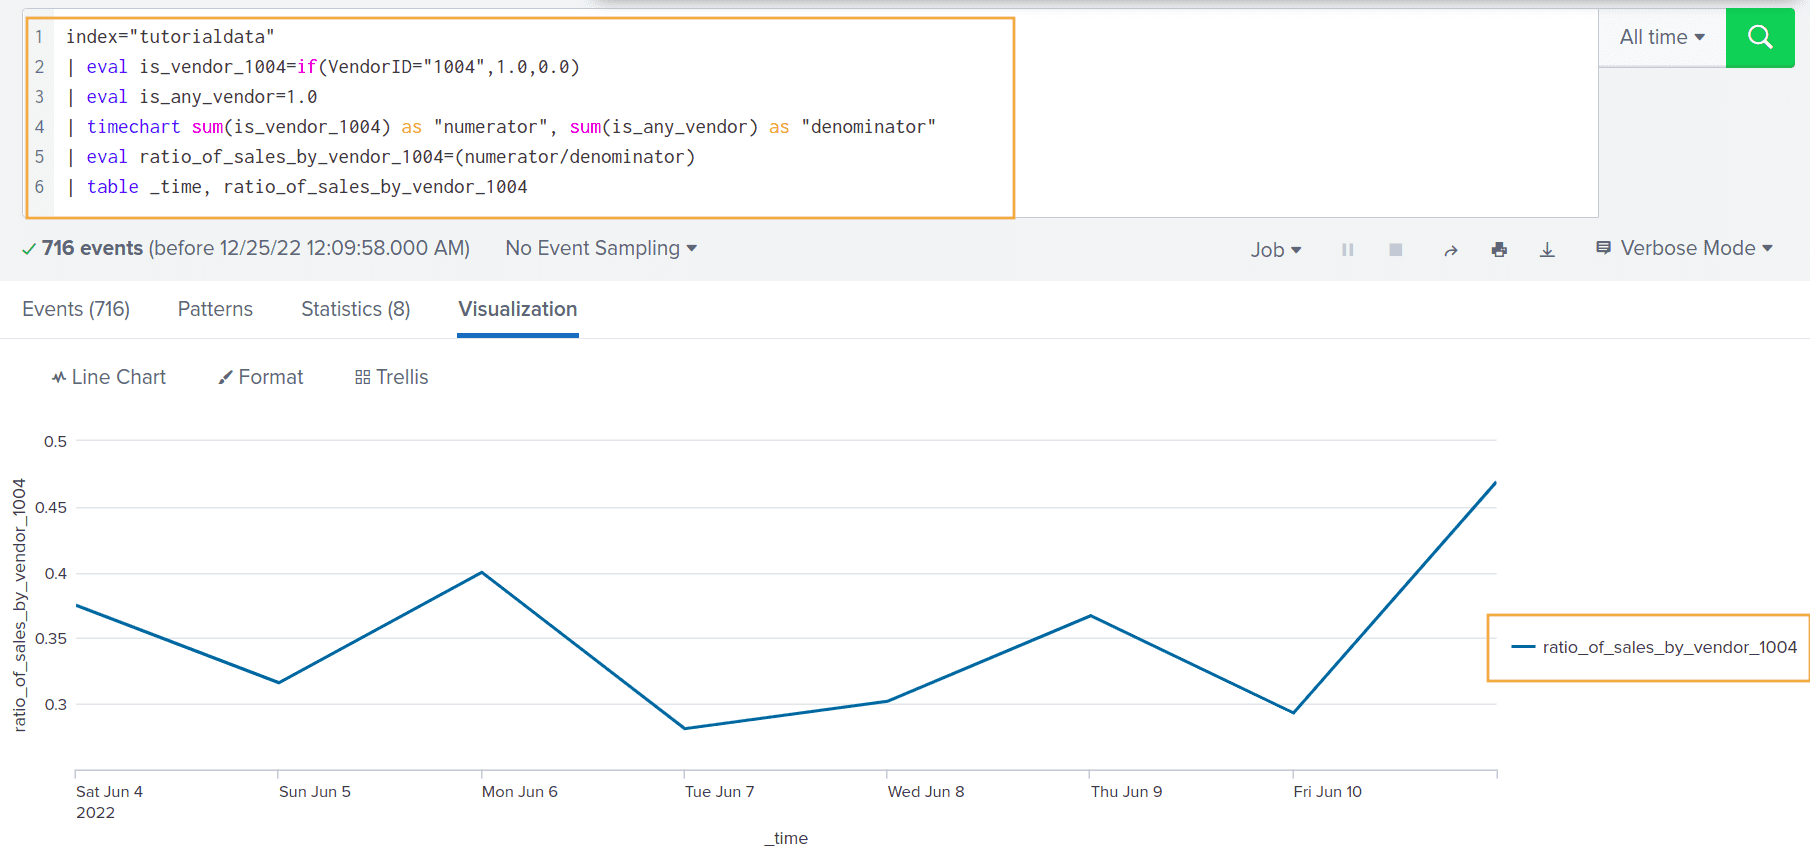 The rate of sales made by
 Vendor 1004 ranges from 0.281 to 0.469, depending on the day!
(Note that we call
timechart and then table at the end)