Splunk Groupby: Examples with Stats
Last updated:- Group by count
- Group by count, by time bucket
- Group by averages and percentiles, time buckets
- Group by count distinct, time buckets
- Group by sum
- Group by multiple fields
For info on how to use
rexto extract fields: Splunk regular Expressions: Rex Command Examples
Group-by in Splunk is done with the stats command.
General template: search criteria | extract fields if necessary | stats or timechart
Group by count
Use stats count by field_name
Example: count occurrences of each field my_field in the query output:
source=logs "xxx"
| rex "my\-field: (?<my_field>[a-z]) "
| stats count by my_field
| sort -count
Group by count, by time bucket
Use timechart count by field_name instead of stats
source=logs "xxx"
| rex "my\-field: (?<my_field>[a-z]) "
| timechart span=30m count by my_field
Group by averages and percentiles, time buckets
The field must be numeric
You can have multiple aggregations in a single pass:
Use timechart with timechart and aggregation functions such as avg, p50, p90, p99, etc:
source=logs "xxx"
| rex "my\-numeric-\-field: (?<my_numeric_field>[0-9]+) "
| timechart span=30m avg(my_numeric_field), p90(my_numeric_field), p99(my_numeric_field)
Group by count distinct, time buckets
How many unique values for my_field for each 1-minute bucket?
source=logs "xxx"
| rex "my\-field: (?<my_field>[a-z]) "
| timechart span=1m distinct_count(my_field)
Group by sum
Use stats sum(value_field_name) by group_field_name
Sample logs
... customer="john doe" order_value=20 ...
... customer="mary white" order_value=25 ...
... customer="john doe" order_value=100 ...
Example query Sum the total order value for each different customer:
source=order_logs
| rex " customer=\"(?<customer>[^\"]+)\" "
| rex " order_value=(?<order_value>[0-9]+) "
| stats sum(order_value) as sum_order_value by customer_id
| sort -sum_order_value
Result:
|---customer----|---sum_order_value--|
| john doe      | 120                |
| mary white    | 25                 |
Group by multiple fields
All examples use the tutorial data from Splunk running on a local Splunk version
Combine both fields using eval and then use stats:
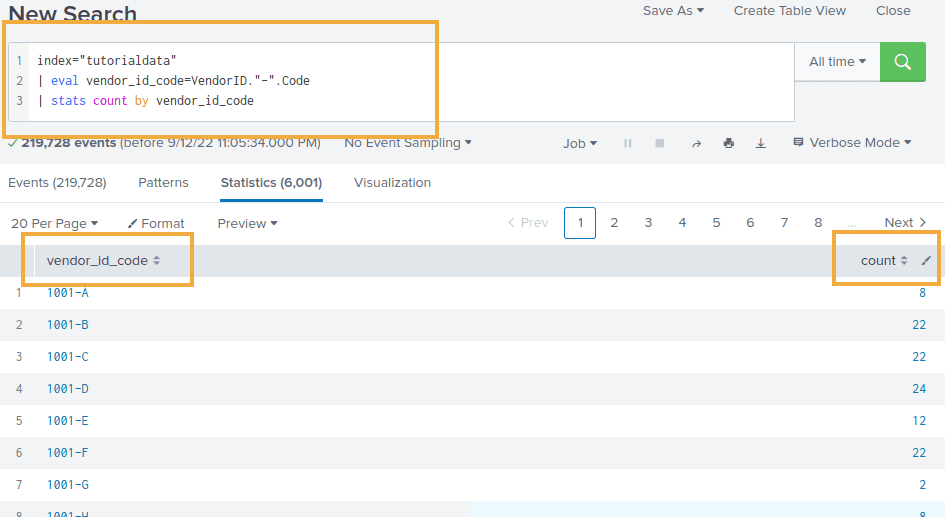
Example: group by count Vendor ID and Code, together:
index="tutorialdata"
| eval vendor_id_code=VendorID."-".Code
| stats count by vendor_id_code
 Just build a new field using
 eval and . and group on that