Scaling Data Teams
Last updated:
- 5 Needs of data teams
- Data Analysts vs Data Scientists
- Relational vs Non-relational Databases
- Row-based vs Column-based data stores
- Excel is still useful at many scales
- Stakeholder communication
- Metrics
Original content: Data Teams with Rya Sciban on SE Daily Podcast
Interesting podcast episode on Software Engineering Daily, where the hosts talk about what specific needs data teams have and what changes when you go from small-scale to large-scale data science.
5 Needs of data teams
Having easy access to data (preferably at a single location throughout the organization)
Having the means to analyze and visualize data (i.e. good tools)
Being able to easily reproduce analyses and research (again, good tools but also processes)
Sharing insights and findings in the form of reports and or presentations (ditto)
Automating recurrent work (maybe built into tools, but often manually scripted)
Data Analysts vs Data Scientists
| Data Analysts | Data Scientists |
|---|---|
| Work with SQL, Excel | Work with scripting tools such as R, Python or SAS |
| Focus on reporting, using existing data | Focus on training ML models for predictive or exploratory analysis |
Relational vs Non-relational Databases
There's a tradeoff between flexibility and consistency.
Non-relational databases allow for more flexibility but there may be a higher risk of inconsistency (because the data may not be normalized as in relational databases)
Row-based vs Column-based data stores
Column-based data stores are more suitable for most analytics workflows because you are very often interested in viewing a single attribute over many records (as opposed to viewing the same record over many attributes)
Row-based stores sometimes allow you do remodel your existing row-based data as columns, for example using the PostgreSQL Columnar Store Extension for Postgres versions starting from 9.3.
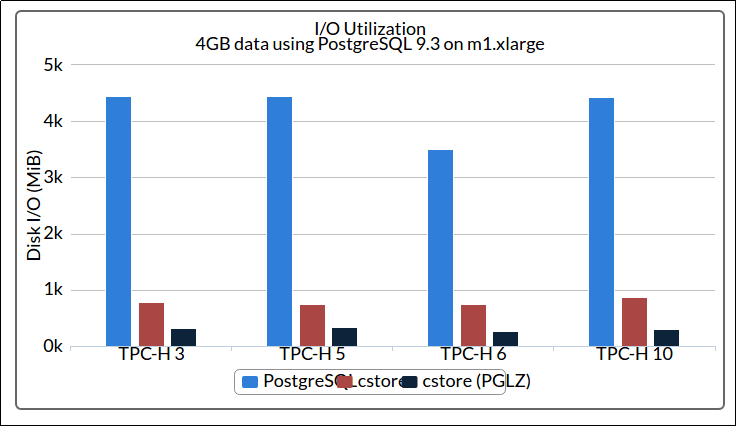 Dramatically lower IO usage when using columnar data store (brown
 and black) vs regular Postgres data types (blue)
Source: citusdata.com
Excel is still useful at many scales
It's easy to use and intuitive.
Especially for exploratory and ad-hoc (one-off) analysis.
Stakeholder communication
Try to understand the user's actual problem and needs rather than just blindly implementing what you're asked to do.
By talking (really listening) to your stakeholders you can help them understand the data work your team is doing you can suggest other ways of tackling problems.
For example, developing a simpler solution that covers 80% of their needs for 20% of the cost is a massive win.
Metrics
If you build data products, you want to collect metrics so that you know what specific features your users/stakeholders are using, for example:
What features are more often used, by what types of users?
What features are really not worth their screen real estate?
- I.e. maybe you could hide them from the product's UI so as to reduce clutter and improve usability?
This short post is part of the Data Newsletter. Click here to sign up.
References
citusdata/cstore_fdw Postgres Extension Github
- Provides all sorts of optimizations for modelling Postgres data as columns.
- Uses ORC (Optimized Row Columnar) format.