Pandas DataFrame: GroupBy Examples
Last updated:- Concatenate strings in group
- Number of unique values per group
- Sort groupby results
- Plot Groupby Count
- Plot Groupby Sum
- GroupBy Plot Mean with error bars
- Multiple aggregations, single GroupBy pass
- Flatten hierarchical indices
- Iterate over groups
- For group in groups
- Change aggregation column name
- Get group by key
- List values in group
- Custom aggregation
- Sample rows after groupby
For Dataframe usage examples not related to GroupBy, see Pandas Dataframe by Example
View all examples in this post here: jupyter notebook: pandas-groupby-post
Concatenate strings in group
This is called GROUP_CONCAT in databases such as MySQL. See below for more exmaples using the
apply()function.
In the original dataframe, each row is a tag assignment.
import pandas as pd

df = pd.DataFrame({
    'user_id':[1,2,1,3,3,],
    'content_id':[1,1,2,2,2],
    'tag':['cool','nice','clever','clever','not-bad']
})

df.groupby("content_id")['tag'].apply(lambda tags: ','.join(tags))
After the operation, we have one row per content_id and all tags are joined with ','.
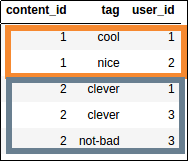 Source dataframe
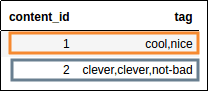 All tags given to each content
Number of unique values per group
How many unique users have tagged each movie?
import pandas as pd

df = pd.DataFrame({
    'user_id':[1,2,1,3,3,],
    'content_id':[1,1,2,2,2],
    'tag':['cool','nice','clever','clever','not-bad']
})

df.groupby("container_id")["user_id"].nunique().to_frame()
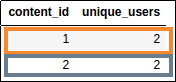 How many users tagged each content?
Sort groupby results
Turn the GroupBy object into a regular dataframe by calling .to_frame() and then reindex with reset_index(), then you call sort_values() as you would a normal DataFrame:
import pandas as pd

df = pd.DataFrame({
    'value':[20.45,22.89,32.12,111.22,33.22,100.00,99.99],
    'product':['table','chair','chair','mobile phone','table','mobile phone','table']
})

df1 = df.groupby('product')['value'].sum().to_frame().reset_index()

df2 = df.groupby('product')['value'].sum().to_frame().reset_index().sort_values(by='value')
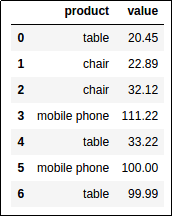 Original Dataframe
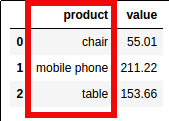 Total value for each product:
 df1 has the default ordering
 Total value for each product:
 df2 has been ordered by value, ascending
Plot Groupby Count
For many more examples on how to plot data directly from Pandas see: Pandas Dataframe: Plot Examples with Matplotlib and Pyplot
If you have matplotlib installed, you can call .plot() directly on the output of methods on GroupBy objects, such as sum(), size(), etc.
import pandas as pd
import matplotlib.pyplot as plt

df = pd.DataFrame({
    'value':[20.45,22.89,32.12,111.22,33.22,100.00,99.99],
    'product':['table','chair','chair','mobile phone','table','mobile phone','table']
})

# use .size() to get a "count" of each group
df.groupby('product').size().plot(kind='bar')
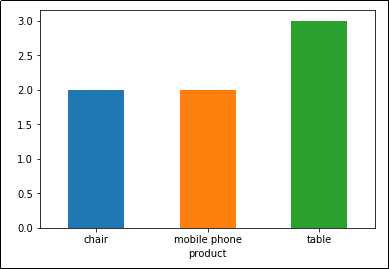 Plot: Number of records by product
Plot Groupby Sum
As above, bu using sum as the aggregator function, instead of count:
import pandas as pd
import matplotlib.pyplot as plt

df = pd.DataFrame({
    'value':[20.45,22.89,32.12,111.22,33.22,100.00,99.99],
    'product':['table','chair','chair','mobile phone','table','mobile phone','table']
})

df.groupby('product').sum().plot(kind='bar')
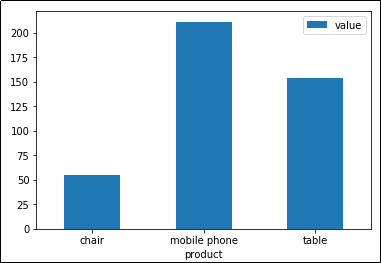 Plot: Sum of column
 value by product. Pandas automatically sets axes and legends too
GroupBy Plot Mean with error bars
Add error bars (mean +/- the standard deviation1) to help people understand whether they can trust the averages or whether variance is too high:
import pandas as pd
import matplotlib.pyplot as plt
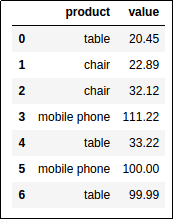
df = pd.DataFrame({
'purchase_price':[28.45, 25.89,32.12,99.99,120.00,170.00,12.22,28.22,5.00],
'product':['table','table','table','mobile phone','mobile phone','mobile phone','chair','chair','chair']
})
ax = plt.gca()
# plot the means
df.groupby('product').mean().plot(kind='bar',color='lightblue',ax=ax)
# generate a dataframe with means and standard deviations
grouped_df=df.groupby('product').agg([np.mean,np.std])
# flatten column names
grouped_df.columns = [col for col in v.columns.values]
# iterrows is usually very slow but since this is a grouped
# dataframe, there wonly be many rows
for i,(index,row) in enumerate(grouped_df.iterrows()):
name = row.name
mean = row['mean']
stddev = row['std']
# plot the vertical line for this group
ax.vlines(x=i,ymin=mean-stddev,ymax=mean+stddev)
plt.show()
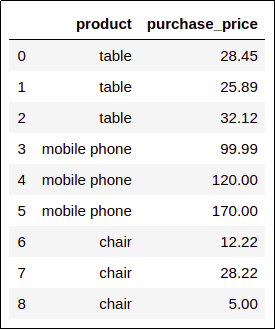 Original Dataframe
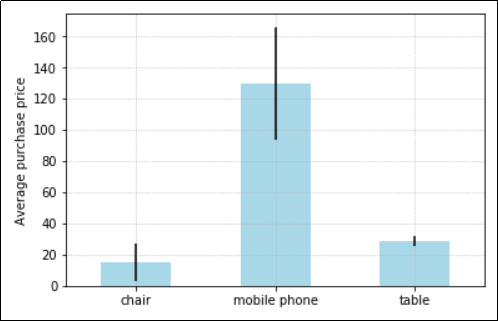 The average purchase price for each product.
 The black bars shows how different, on average, prices are
from the average in that group.
This helps people understand if the average can
be trusted as a good summary of the data.
Multiple aggregations, single GroupBy pass
Say, for instance, ORDER_DATE is a timestamp column. We want to find out the total quantity QTY and the average UNIT price per day.
Note: we're not using the sample dataframe here
grouped = df.groupby(p7.ORDER_DATE.dt.day).agg({
    "QTY":np.sum,
    "UNIT": np.mean
})
Flatten hierarchical indices
It's useful to execute multiple aggregations in a single pass using the DataFrameGroupBy.agg() method (see above).
But the result is a dataframe with hierarchical columns, which are not very easy to work with.
You can flatten multiple aggregations on a single columns using the following procedure:
import pandas as pd

df = pd.DataFrame({
    'value':[20.45,22.89,32.12,111.22,33.22,100.00,99.99],
    'product':['table','chair','chair','mobile phone','table','mobile phone','table']
})

# call
grouped_df = df.groupby('product').agg({'value':['min','max','mean']})
At this point, join together the columns, with '_' in between and the reset the index:
grouped_df.columns = ['_'.join(col) for col in grouped_df.columns.values]
grouped_df = grouped_df.reset_index()
 Original Dataframe
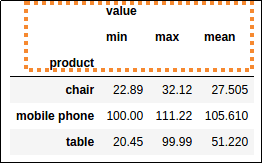 The
The agg() method creates a hierarchical index
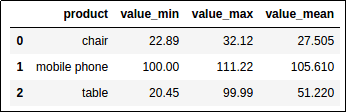 Much better: Join hierarchical columns together
 using
'_' and then call reset_index() for a simpler index structure
Iterate over groups
To iterate over dataframe groups in groupby(), the object returned by the call itself can be used as an iterator:
for key,group_df in df.groupby('product'):

    # `key` contains the name of the grouped element
    # i.e. 'chair', 'mobile phone', 'table'

    # `group_df` is a normal dataframe
    # containing only the data referring to the key

    print("the group for product '{}' has {} rows".format(key,len(group_df)))

# >>>
# the group for product 'chair' has 2 rows
# the group for product 'mobile phone' has 2 rows
# the group for product 'table' has 3 rows
For group in groups
See above: Iterate over dataframe groups
Change aggregation column name
By default, aggregation columns get the name of the column being aggregated over, in this case value
import pandas as pd

df = pd.DataFrame({
    'value':[20.45,22.89,32.12,111.22,33.22,100.00,99.99],
    'product':['table','chair','chair','mobile phone','table','mobile phone','table']
})

grouped_df = df.groupby('product')['value'].sum().reset_index(name='value_sum')
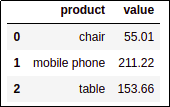 By default, aggregation columns get the name of the
 column being aggregated over, in this case
value
 Give it a more intuitive name using
 reset_index(name='new name')
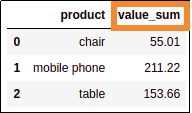
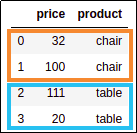
Get group by key
After calling groupby(), you can access each group dataframe individually using get_group().
import pandas as pd

df = pd.DataFrame({
    'value':[20.45,22.89,32.12,111.22,33.22,100.00,99.99],
    'product':['table','chair','chair','mobile phone','table','mobile phone','table']
})

# grouped_df is a DataFrameGroupBy containing each individual group as a dataframe
grouped_df = df.groupby('product')

# you get can a dataframe containing the values for a single group
# using .get_group('group_key')
grouped_df.get_group('chair')
 Results of
 .get_group('chair'): only results in
'chair' group are returned
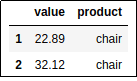
List values in group
See below for more examples using the
apply()function.
Use apply with a custom function.
For example, get a list of the prices for each product:
import pandas as pd

df = pd.DataFrame({
    'value':[20.45,22.89,32.12,111.22,33.22,100.00,99.99],
    'product':['table','chair','chair','mobile phone','table','mobile phone','table']
})

# note that the apply function here takes a series made up of the values
# for each group. We then call the .tolist() method on the series to make
# it into a list
df.groupby('product')['value'].apply(lambda group_series: group_series.tolist()).reset_index()
 Group values for each group into a list
Custom aggregation
Use apply(func) where func is a function that takes a Series representing a single group and reduces that Series to a single value.
Example: get count of even values in each group
import pandas as pd

df = pd.DataFrame({
    'value':[20,22,32,111,33,100,99],
    'product':['table','chair','chair','mobile phone','table','mobile phone','table']
})

# you can define a function like this or use a lambda function
def count_even_numbers(series):
  return len([elem for elem in series if elem % 2 == 0 ])

df.groupby('product')['value'].apply(count_even_numbers).reset_index(name='num_even_numbers')
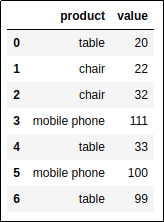 Original dataframe
 How many even-numbered values in each group?
Sample rows after groupby
This is also called stratified sampling.
The easiest way to do this is df.groupby(<colname>).apply:
import pandas as pd

df = pd.DataFrame({
  'price':[20,22,32,111,33,100,99],
  'product':['table','chair','chair','table','table','chair','table']
})

# you could just as easily group by multiple columns here
df.groupby("product").apply(
  lambda group_df: group_df.sample(2) # any dataframe function could be used here
).reset_index(drop=True) # fixes the index
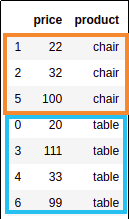 Source dataframe with chairs and tables
 Sampled dataframe, with 2 samples
 per group.
Your results may vary because
this is a random sample.
1: This is actually the standard error; this is the name given to the sample standard deviation.