Pandas DataFrame by Example
Last updated:
- Read CSV file into DataFrame
- Write to CSV
- Select rows by position
- Select Rows by index value
- Select rows by column value
- Select rows by multiple column values
- Select columns starting with
- Select all columns but one
- Apply aggregate function to every column
- Apply aggregate function to every row
- Shuffle rows
- Iterate over rows
- Sort by column value
- Custom sort
- Select rows, custom criteria
- Verify that dataframe includes specific values
Pandas is a very versatile tool for data analysis in Python and you must definitely know how to do, at the bare minimum, simple operations on it.
View this notebook for live examples of techniques seen here
Updated for version: 0.20.1
So here are some of the most common things you'll want to do with a DataFrame:
Read CSV file into DataFrame
See CSV Quoting and Escaping Strategies for all ways to deal with CSV files in pandas
# needed all around
import pandas as pd

# the
df = pd.read_csv("data.csv")
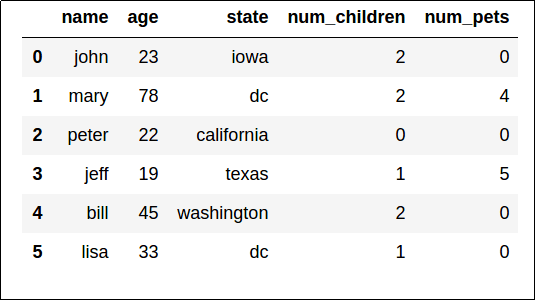 This is what our sample dataset looks like
To use a column in the file as the dataframe index, use index_col argument:
import pandas as pd

# note that Pandas will NOT warn you if the column you've selected
# is NOT unique!
df = pd.read_csv("data.csv",index_col='MyColumn')
Write to CSV
See CSV Quoting and Escaping Strategies for all ways to deal with CSV files in pandas
# simplest possible usage
df.to_csv("data-out.csv")
Omit the index column for a cleaner CSV file:
df.to_csv("data-out-no-index.csv", index=False)
Select rows by position
Just use iloc. Position starts at 0.
The same rules apply as in regular python list slicing
# select the first 2 rows
df.iloc[:2]

# select the last 2 rows
df.iloc[-2:]
Select Rows by index value
Just use loc.
compare this with iloc above
# select rows up to and including the one
# with index=2 (this retrieves 3 rows)
df.loc[:2]
Select rows by column value
# people whose "age" is greater than 30
df[df["age"] > 30]

# people who have more pets than children
df[ df["num_pets"] > df[ "num_children"] ]
Select rows by multiple column values
# people older than 40 who own pets
df[ (df["age"] > 40) & (df["num_pets"] > 0) ]
Select columns starting with
Select all columns starting with 'n':
df[[colname for colname in df.columns if colname.startswith('n')]]
Select all columns but one
Use df.drop(). Note the axis=1 parameter.
Columns must be passed as a list (even if it's a single column).
# df itself is not modified; a copy is returned instead
df.drop(["age","num_children"],axis=1)
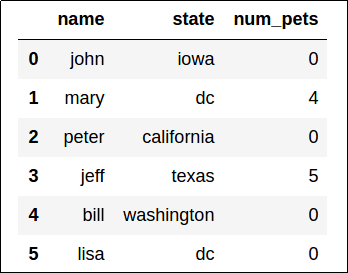 A new dataframe is returned, with columns "age" and "num_children" removed.
Apply aggregate function to every column
More examples here: Pandas dataframe examples: Column Operations For every numeric column, what is the average over all rows?
Note that our resultset contains 3 rows (one for each numeric column in the original dataset).
df[["age","num_pets","num_children"]].apply(lambda row: np.mean(row),axis=0)
# >>
# age             36.666667
# num_pets         1.500000
# num_children     1.333333
Apply aggregate function to every row
The same as above, but axis=1 is used.
For every row, what is the sum of all numeric columns?
# note that our resultset will have 6 rows (one for every row in the
# original dataset)
df[["age","num_pets","num_children"]].apply(lambda row: np.sum(row),axis=1)
# >>
# 0    25
# 1    84
# 2    22
# 3    25
# 4    47
# 5    34
Shuffle rows
Method reindex() can be used to reindex your data and, if you pass random indices, you'll have shuffled your data:
import numpy as np

# using a random permutation of the original indices
df_shuffled = df.reindex(np.random.permutation(df.index))
Iterate over rows
Full post on iterating here: Looping over Dataframe Rows
Use for row in df.iterrows().
This is slow. Only use for small dataframes
for index,row in df.iterrows():
    print("{0} has name: {1}".format(index,row["name"]))
# >>
# 0 has name: john
# 1 has name: mary
# 2 has name: peter
# 3 has name: jeff
# 4 has name: bill
# 5 has name: lisa
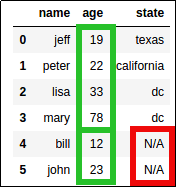
Sort by column value
# sort by "age" column, larger to smaller
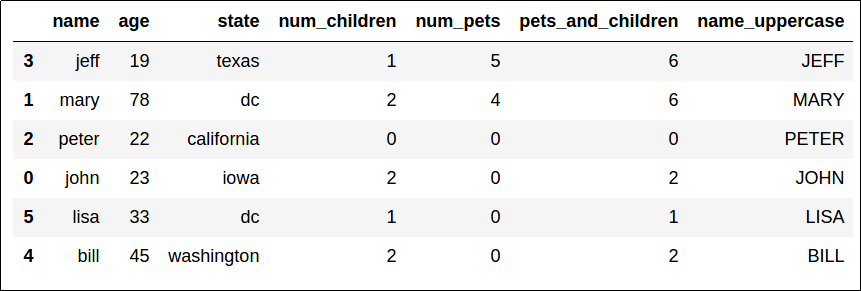
df.sort_values("age",ascending=False)
 Sorted by "age", descending.
You can also use multiple columns to break ties:
# sort by column "num_pets" descending and in case there
# are ties, use "age" ascending to sort those
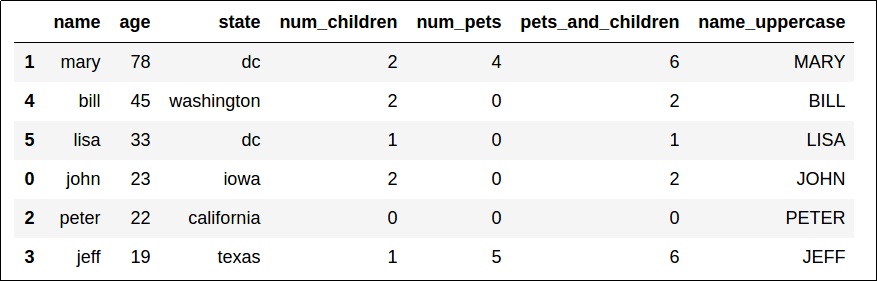
df.sort_values( ["num_pets","age"], ascending=[False,True] )
 Sorted by "num_pets" (descending), then by "age" (ascending) to break ties.
Custom sort
Sort records by age, but put everybody with state="N/A" at the end.
Create a new column rank and use that in sorting:
import pandas as pd

df = pd.DataFrame({
    'name':['john','mary','peter','jeff','bill','lisa'],
    'age':[23,78,22,19,12,33],
    'state':['N/A','dc','california','texas','N/A','dc']
})

# use this function to convert a state string to 0 or 1
def state_to_rank(state):
    if state=="N/A":
        return 1
    else:
        return 0

df['rank'] = df['state'].map(lambda x: state_to_rank(x))

df.sort_values(by=['rank','age'])
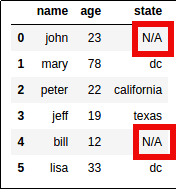 The real world has
 lots of missing data
 Ages are sorted in each group
Select rows, custom criteria
df.query()is a good option too: Pandas Query Examples
For something more complex that the regular df[df['somecolumn'] == 'somevalue'], use apply with a lambda function:
# select rows whose name begins with the letter 'j'
df[df.apply(lambda row: row['name'].startswith('j'),axis=1)]
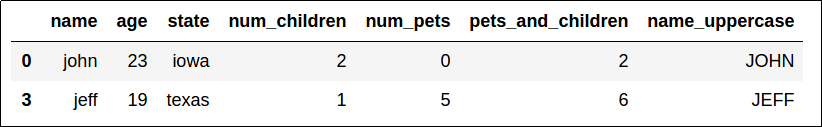 Filter only rows where column "name" starts with 'j'
Verify that dataframe includes specific values
Use .isin(). It returns a boolean dataframe to indicate where the passed values match.
# if the method is passed a simple list, it matches
# those values anywhere in the dataframe
df.isin([2,4])
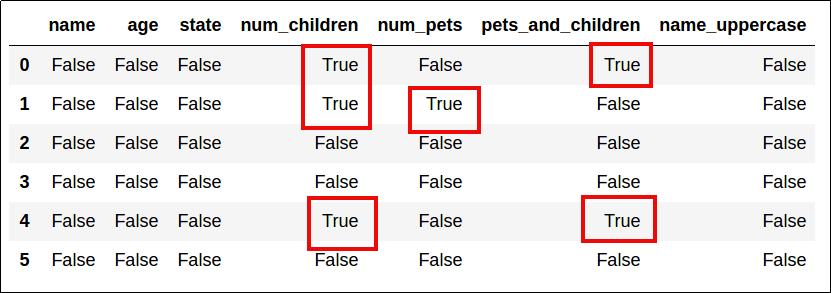 Elements that match the values in the original dataframe become
 True
# you can also pass a dict or another dataframe
# as argument
df.isin({'num_pets':[4,5]})
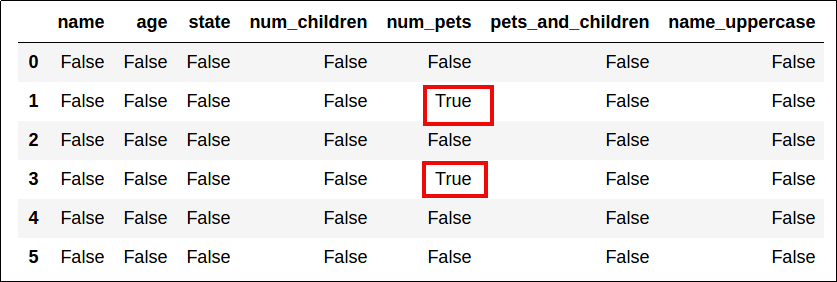 When a dict is passed, columns must match the dict keys too.