Project Review: Text Classification of Legal Documents (Another one)
Last updated:This post is mainly geared towards data scientists using python, but users of other tools should be able to relate.
Not to be confused with a similar project: Project Review: Text Classification of Legal Documents
Creating value
Hybrid solutions
It is very often the case that text-related problems have parts that can be addressed with hard rules and parts that need to be solved with models.
For example, say you need to classify texts into classes.
Some classes have clearly-defined criteria of the type: if string "XYZ" is present in the text, then it is ALWAYS of class A
Other classes have less clear rules; you must apply standard NLP modelling on those.
When faced with problems such as these, one approach you can take is to apply hard-rules to cases where those are possible and apply NLP modelling to the rest.
You will end up with a hybrid system where a) some examples will be classified with 100% confidence (those where hard-rules match) and b) other examples with be classified with a model and given some probability of belonging to one class.
80/20 Thinking
Rarely if ever can we fully solve a problem with some clean model and that's it. Real-life data science is not a kaggle competition.
Very often you will be able to solve 80% of the problem with a simple solution and you will have to treat edge cases differently, incorporate business knowledge, etc.
Always think Pareto and suggest initial solutions that cover most cases and think the rest later. This enables you to iterate quickly and, very often, this is enough to fulfill the client's business objectives.
Modelling
One-vs-rest Classifiers and Class imbalance
Since one-vs-rest meta-classifiers train one classifier for each class, they aren't affected so much when some classes are much more common than others.
When you use those to train a probabilistic classifier, each sub-classifier will assign a True label to instances of a class and False to instances of all other classes.
Although this is affected by skewness, this is less of a problem here than in multi-class classifiers where the probabilities must sum to one. In those cases, rarer classes will practically never be detected.
Some classifiers support multi-class classification out-of-the-box, most often in a one-vs-rest regimen.
Calibrated classifiers
Introduction to AUC and Calibrated classifiers with examples using scikit-learn
As you probably often see on this website, calibrated classifiers are key to help clients use model outputs.
If the scikit-learn classifier you are using does not provide a .predict_proba() method, you can easily calibrate it using a CalibratedClassifierCV()
# linearsvc does not provide probabilistic predictions
# out of the box but you can wrap it in a calibratedclassifier
clf = CalibratedClassifierCV(LinearSVC())

# fit it on data/targets
clf.fit(...)

# it now has a predict_proba method
clf.predict_proba(...)
Measuring rule-based classification
You must analyse hard rules and rule-based classification the same way you would a model.
The first impulse when analyzing hard rules is to give overall metrics like coverage and how much they get right.
But for multi-class problems, these will be used to output a single class so they must be analyzed and evaluated in terms of precision, recall, accuracy, false-negatives, false-positives, etc.
Precision over recall for rules
When dealing with hard rules, you should favour precision over recall.
It's easier to explain to clients that, in some cases, we are able to provide perfect (100% confidence) with rules and other times we need to model and therefore approximate results will be output.
In my opinion, you should only apply hard rules in cases you can get 100% precision (even if at a low recall level - use modelling on those)
Code quality
Code structure
This is one example of a project/code structure5 that worked well for this project.
|--src/            <--- common code used in analysis, trainign, serving
  |-- helpers/
  |-- utils/
  |-- models/
|-- api/           <-- API code for serving. Uses code from src/
|-- data
  |-- raw/
  |-- processed/
  |-- analysis
|-- notebooks/     <-- Notebooks. Use code from src/ as much as possible
  |-- production/
    |-- training   <-- trains a new model given some data
    |-- scoring    <-- loads a trained model, applied preprocessing and scores a new dataset
  |-- development/ <-- analysis notebooks, split by sprint (weekly)
    |-- sprint 1/
    |-- sprint 2/
Preprocessing in functions
You should wrap preprocessing code (i.e. text preprocessing) into functions as soon as possible.
It's as simple as wrapping code into a def that takes an input dataframe and returns the modified dataframe.
Then you move those functions to helper files, so as not to clutter the analysis notebooks too much.
Actionable error messages
Include, at the very minimum, what was expected and what actually happened, so people can know where to go to fix the problems.
Error messages should inform the user what the problem is and how to fix it. It should be roughly understandable even for non-programmers.
In data systems, usually clients/operators themselves should be able to fix their data themselves using the system error messages. Examples:
Bad
Any raw Python Exception message such as
KeyError, etcInvalid value: 'foo bar'
Cannot use strategy Y for object type X
Good
Expected argument $arg1 in function func_1 to be one of ['foo', 'bar', 'baz'], got 'xxx' instead
Module_X#func_y: Expected $var1 to be a valid string, got a 'int' (42) instead.
When using strategy A, parameter $arg should 'foo bar' because it is needed by module B. Got 'xxx' instead.
Windows woes
If there is a chance your notebooks and models will be run on Windows, here are some things you want to watch out for:
1) Explicitly set
engine='python'when using dataframe.query()2) Explicitly set encoding to
'utf-8'whenever reading/writing files, including JSON
Pandas
Use df.sample() instead of df.head()
Using df.head() is a common way to have a quick look at a Pandas dataframe but it can fool you because the first data points are often not a representative sample of the full dataset.
This is because it frequently the case that datasets are not randomized. In order words, if you always use head() instead of sample() to look at your data, you may be looking at:
Old data (if the dataframe is sorted by date)
Data from a single class (if the dataframe is sorted by class)
Another issue is that each time you call sample() you get a different set of points 1 so the likelihood that you'll spot something weird is higher.
Use pd.isnull to check for None
It is frequently the case that some types or dataframe columns end up with None to signal missing values while others use Numpy's nan: (np.nan).
Do yourself a favour and always use pd.isnull to check if something is missing; it will work as expected most of the time.
Overuse parentheses when combining masks
If you ever see yourself building complex filtering logic on dataframes, make sure you pt parentheses eveywhere to leave no ambiguity as to what logic is being applied.
GOOD:
df[(df['a_column']=="some_value") and (df["other_column"].notnull())]BAD:
df[df['a_column']=="some_value" and df["other_column"].notnull()]
Just sample
You can reach most conclusions (one strategy is better than other, one feature encoding is better than the other) using samples.
It seems obvious and not worthy of mentioning, but sometimes we want full certainty so we use the full dataset, but a sample would do just as fine.
This keeps cycles fast and makes exploratory work more enjoyable and productive overall.
Testing
There are some helper functions in pandas to help you test if two series/dataframes have the same content:
from pandas.testing import assert_frame_equal, assert_series_equal

assert_frame_equal(df1, df2)

assert_series_equal(s1, s2)
Display precision
Your work has users (clients and stakeholders) and those users will either have a good or bad experience interacting with your work
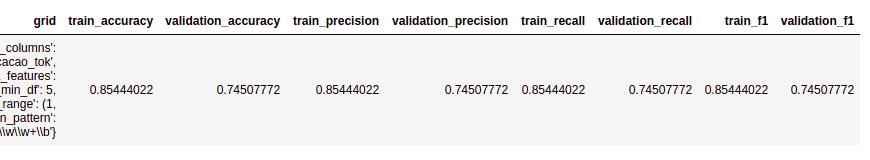 This is bad
 Don't do this
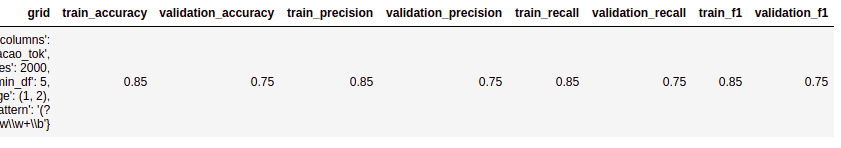 This is much better
Storytelling and reporting
Report results by class
If you are working with multi-class classification or any type of problem where there are multiple domain areas, you must report results by class, not just global results.
So for every metric that you report, you must also report the per-class values, because these often display a lot of variance.
It's very common that classes are imbalanced, some areas have better data than others, etc.
Table of contents
It is very helpful to business analysts and to clients when you have a table of contents in your analysis notebooks.
It is easy to setup (see link above) and it makes it much easier to navigate complex notebooks with several steps.
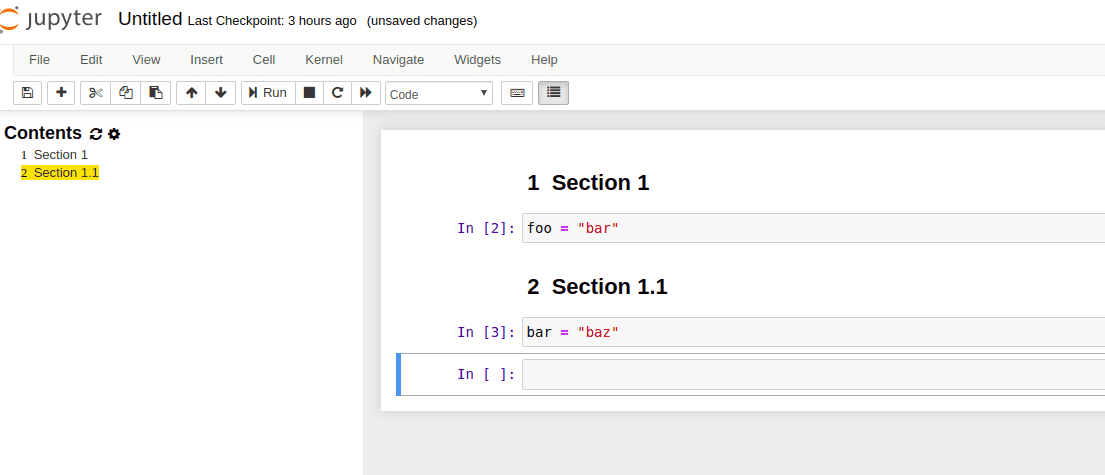 Each sections gets turned into a
 clickable link on the left
Scored datasets
Whenever training or experimenting with new modelling strategies, make it so that a scored dataset is produced at the end of the notebook.
This is very useful for business analysts/clients to actually see the outcomes.
A scored dataset includes a) all ids and features, b) column indicating if the row was in the train or test validation set and c) the model output.
Always be ordering
It's hard to parse and follow the conclusions in a deep analytical notebook, especially when you were not the one writing it.
It's somewhat easier to do it when things are ordered in a consistent manner throughout the analysis.
It reduces the mental burden of whoever is reading it (including yourself), enables us to catch inconsistencies and mistakes easier, etc.
When in doubt, just sort things alphabetically. But above all, sort it.
For example:
Report scores by class? Always show the classes in the same order
Show results for each sub-population? Always show the subpopulations in the same order.
Plotting results? Sort the legends accordingly (example for matplotlib: Reorder labels in legend)
Client management
Examples, examples, examples
Clients don't always have direct access to the data you are working on; it's usually somebody else (IT Ops people) who will collect data and send over to you.
So it is possible that whoever you are interacting with has never actually seen the data, even if they understand about the domain (i.e. they may be domain experts)
So sharing actual examples of the data points themselves2 (screenshots, jupyter notebooks, etc) if usually very helpful to get them to share business insights and validate your hypotheses:
For instance:
Show representative data points for each class/type
Weird examples (things that look out of place)
Outliers
Trust but verify
Don't blindly believe everything clients say about the data, you should verify what they tell you in the data to make sure eveything is in order.
This is not to say that clients are acting in bad faith, obviously; very often people who interact with you are not the same people who understand how the data is created.
It is also your job to go through the data and validate weird stuff with the client.
For example: "I expected the data to contain only products of type X but here are some examples of type Y. Could you help me understand the reason?"
Check data integrity, again and again
Make it into a habit to check for things like duplicates, invalid class values, dataframe shapes whenever you can, for every piece of data you have.
Preferably also after each processing step, because these themselves can introduce problems3
Not magic
It's your job to help clients understand what you're doing; you should explain it in a way that they see that your job isn't based off mathy magic but simple methods applied to data.
Examples are king here: Provide examples to help clients/stakeholders understand what you're doing and use the domain language whenever possible.
Excel files
You need to install package
xlrdfor this
Most business analysts and clients will use MS Excel and frequently it is the tool they are most comfortable with.
It's not hard to go the extra mile and provide results in excel files to make their lives easier:
import pandas as pd

# to read excel file into pandas
pd.read_excel("/path/to/file.xlsx", sheet_name="worksheet_name")

# to write pandas datafrme into excel
df.to_excel(
    "/path/to/output/file.xlsx",
    sheet_name="worksheet_name",
    index=False)
Keep track of datasets clients send
It is often the case that clients send you multiple files or pieces of data over the course of the project.
We usually work on these datasets: apply fixes, merge them, remove bad rows, deduplicate, etc
It is very easy to lose track of what data you are working on, so
Here are two things to help you:
Keep a README file in the
raw/data directory saying when/why each raw dataset was sent, along with the number of rows in it4In your main dataset, keep a column called
sourcesaying where that particular row came from.
1: You can always set random_state to force deterministic behaviour.
2: Not just plots, charts and other aggregate data, mind you.
3: For example, one processing step made all text lowercase. if you had two rows where the only difference between them was the text case, you now have 2 duplicate rows.
4: This is important for troubleshooting because you can usually check if two datasets are the same if they have the same amount of lines in them. Not foolprof, obviously.
5: Loosely based on cookiecutter-data-science, with some twists.